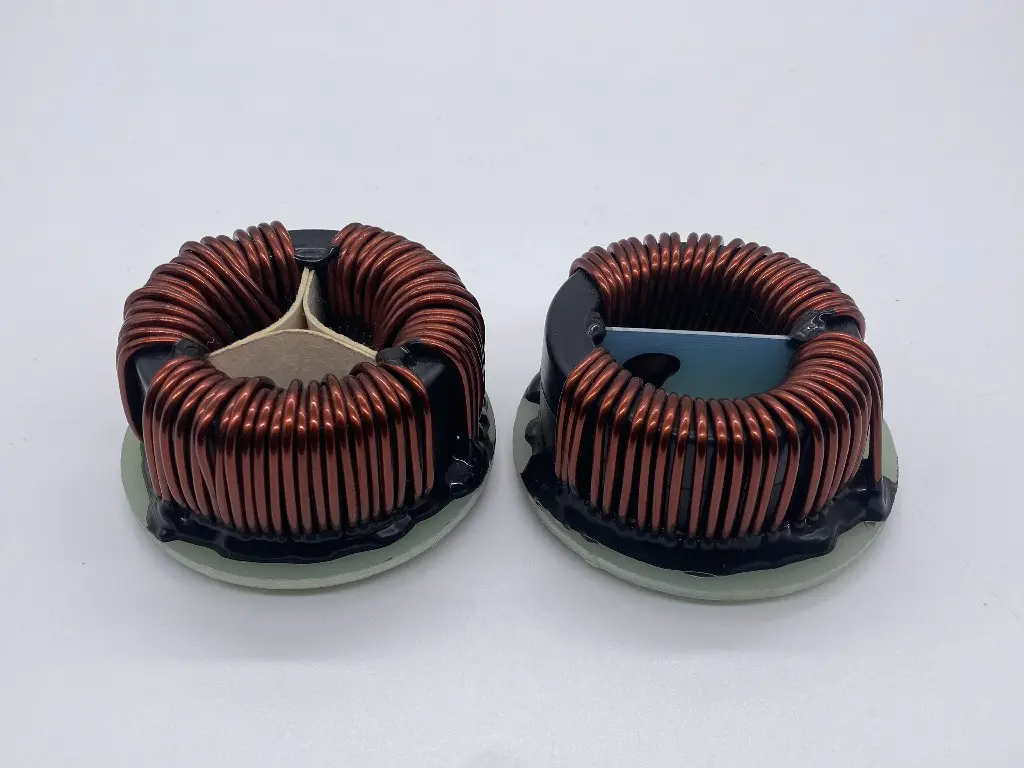

Operating principle of current transformer
The reactor core vibration noise analysis and research
by:Transmart
2021-01-15
2019 - reactor core vibration noise analysis research
03 -
30 15:05:42 so far, the vibration noise control is still the core reactor 2 one of worldwide problems, although there have been some mature theory and technology improvements, but from the perspective of numerical simulation to achieve its full description of the vibration noise, so as to achieve damping noise reduction research is very few, it is based on this, to a certain electric company production series dry iron core reactor (
Hereinafter referred to as the reactor)
As the research object, with multiple physical field finite element method to analyze the vibration noise of the reactor core.
Core analysis of the vibration noise analysis model using ANSYS APDL parametric design language for modeling the reactor core and the surrounding magnetic field.
Among them, the iron core, air gap material, the surrounding air of coil and iron core USES SOLID117 units, iron core, air gap and coil material adopt scanning hexahedron units classification in the form of iron yoke adopts the grid unit and the air.
Finite element model of reactor core and core magnetic field finite element model, respectively, as shown in figure 1.
Research has shown that predominantly structural noise equipment, structure and structure surface vibration speed is proportional to the surface pressures.
Surface vibration method is used the proportional relationship, establish the relationship between structure surface vibration speed and surface sound pressure.
When the reactor is in a state of stable work, the core surface vibration speed and the radiation sound power can be thought of as follows: in relation W—
Sound power;
ρ
0 c0 -
Air characteristic impedance;
S -
Noise radiation surface area;
u -
2 -
On the surface of the vibration Fang Zhensu;
σ
—
The acoustic radiation efficiency.
Visible on the surface of the core velocity reflects its the size of the radiation sound power.
1, the iron core vibration velocity transient response analysis of finite element analysis of iron core USES the finite element model of figure 1, load as the electromagnetic force, constraint using the bar at the bottom of the foundation, response analysis time 0.
1 s, step length 0.
001 s, the speed curve of each point is obtained by finite element analysis in figure 1 of 1 to 5 speed curve, as shown in figure 2.
2, core finite element analysis of noise radiation pressure is atmospheric pressure changes after disturbance, the measurement of sound pressure is easy to implement, it changes over time, the measured sound pressure is the effective value of it, said the size of the sound pressure index called the sound pressure level.
Because of the sound pressure level varies with the change of distance and the environment changes, so in order to accurately said a noise characteristics of the machine, often choose the constant noise sound power level.
At the same time because of the sound power level and sound pressure level has a specific function relationship between, if through the noise of the sound power level to evaluate core size, should first establish structure & ndash;
Sound field coupling finite element model, the model take 3 m radius, sound field using FLUID30 among units, iron core structure & ndash;
Sound field coupling model, as shown in figure 3.
In addition to the fundamental frequency of the spectrum of the noise of the transformer core vibration noise, also contains the integer times frequency as the base frequency of high frequency noise, studies have shown that core reactor is mainly low frequency component of the spectrum of noise.
For 50 hz power supply, the fundamental frequency of 100 hz and 200 hz, 300 hz and 400 hz in the high frequency noise.
Take half a sphere at the top of the time domain response analysis, get the curves of sound pressure, as shown in figure 4,
一)
Shown below.
On the fast Fourier transform, the frequency domain curves, as shown in figure 4 (
b)
Shown below.
By the curve of frequency domain knowledge, core noise which has a peak in 100 hz and the frequency doubling, and 100 hz noise component accounts for a large proportion of the energy of noise mainly concentrated on the 100 hz and the frequency doubling, although this several frequency points is relatively sparse, but basically can reflect the noise of the iron core under electromagnetic force excitation.
In actual measurement of the noise, generally not only in the measurement of sound pressure level at a point, but in a hypothetical surround sound source inventory measurement of sound pressure level, select a number of points on then use these points average sound pressure level to calculate the sound power level.
Had mentioned in front of the sound pressure level and sound power level, is a function relationship between the sound power level is obtained by sound pressure level though of loudness of sound in accord with the characteristics of the auditory, but still is the objective description of sound energy, in the actual measurement, sound level value is an objective levels after weighting to the above.
Years of practice has proved that using A sound level to evaluate noise size, and the feeling of people, both at home and abroad to use A judge noise equivalent sound level or A levels.
Measurement plane of hemispherical, hemisphere symmetrical distributed evenly on the surface of the 11 points measured sound pressure level, by the formula (
2)
Get the average sound pressure level, the formula (
6)
Get the sound power level, A weighting, to get A sound pressure level meter right and the right to A meter sound power level.
The average sound pressure level Lp -
Can press type calculation: type: n—
The number of measuring points.
Refer to the above sound pressure level measurement method [
6]
(
7]
, can extract the hemisphere of several points on the real part and imaginary part of sound pressure amplitude value, according to the formula, the amplitude of sound pressure PA, here we PA is obtained by Fourier transform can be directly, then according to the formula, the effective value of sound pressure Pe, average RMS sound pressure of these points again, and they mean effective pressure value of the Pe.
Type: S—
The surface area of the extracted hemisphere;
Pe—
The extraction of mean effective pressure value of the number of measuring point on the surface of hemisphere.
And then based on the definition of sound power level formula: type: W0 = 10 -
12 w, the sound power can be turned into a corresponding sound power level.
Custom message
Related Products